Morgan McGowan on Jan 20, 2026 · 11 minute read
6 Lies Ecommerce Leaders Tell Themselves
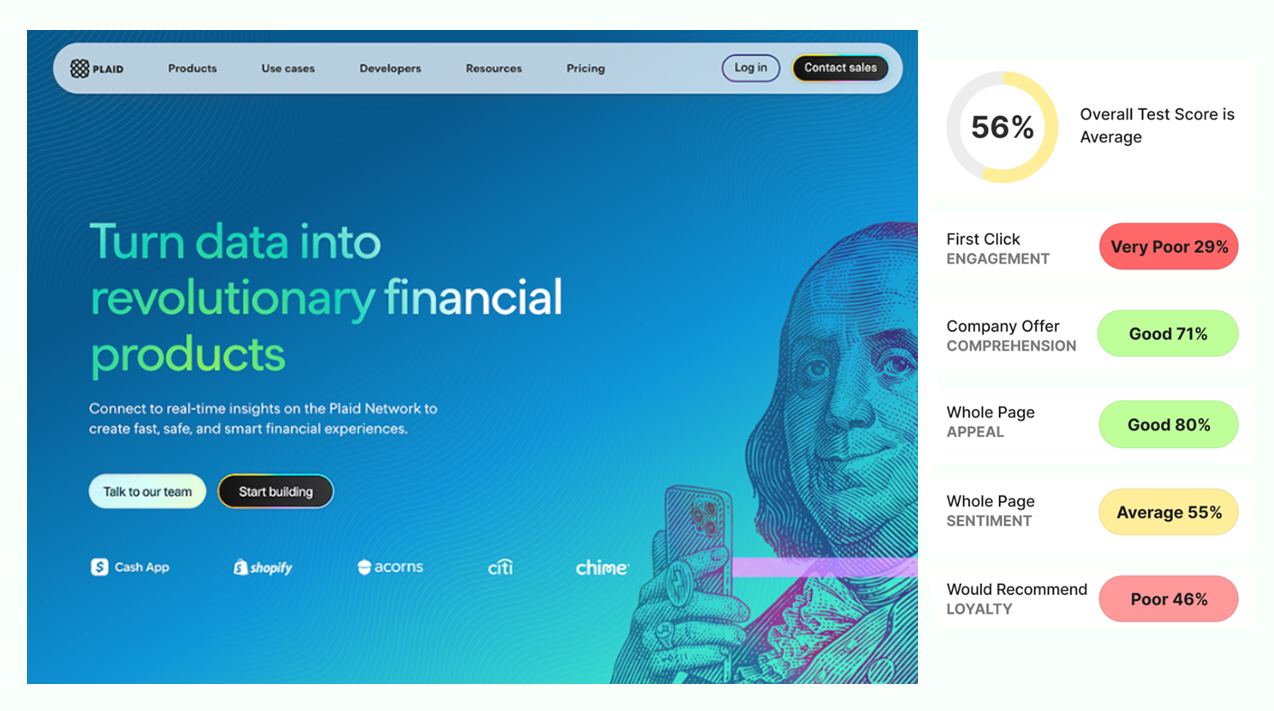
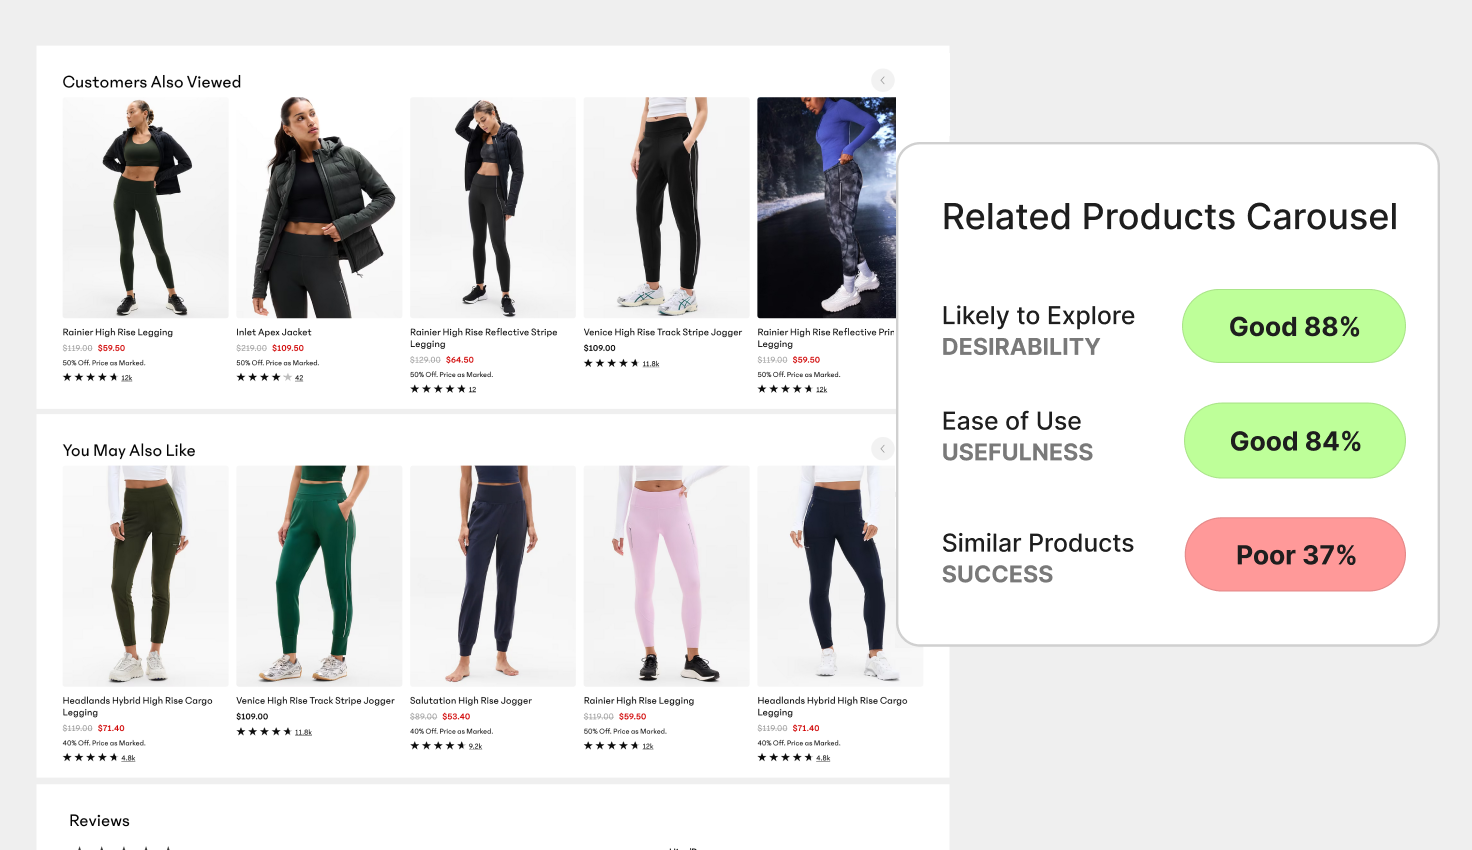
E-commerce teams rarely come to us because something is flat-out broken. More often, it is because an experience looks good but isn't moving people forward as expected.
Read More